

But despite that, average house prices held up across England – even if there was a drop in sales.
It was the same picture in Brighton and Hove, where prices rose by 3.2 per cent in the year to September 2020. Across the South East, prices rose by 3.4 per cent.
In Brighton and Hove, the average price of a house went from £414,777 to £428,074. Overall, 3,009 houses changed hands in Brighton and Hove between October 2019 and September 2020, a drop of 17.3 per cent from 3,637 between October 2018 and September 2019.
The Office for National Statistics (ONS) also publishes house price figures by Middle Layer Super Output Areas (MSOAs) – small geographic areas containing an average of 7,200 people.
These show that 21 of the 33 MSOAs that make up Brighton and Hove saw a rise in house prices over the same period.
Here we reveal the 12 Brighton and Hove neighbourhoods which saw the strongest growth in the year to September 2020.
As well as those below in the top 12, the following areas saw growth in the average house prices: Hove Central (up 5%) Elm Grove and Bear Road (3.7%), Round Hill (3%), West Blatchington (3%), Preston Park (2.9%), Fiveways (2.8%), Hangleton South (2.4%), Aldrington (2.1%) and Bevendean and Moulsecoomb East (0.9%).
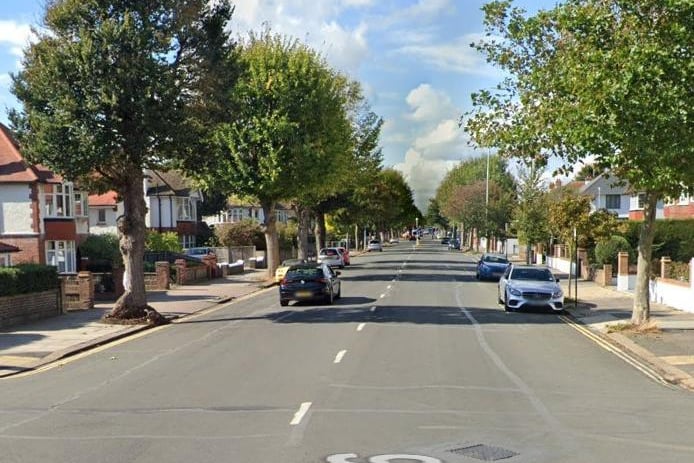
1.
The biggest price hike was in Aldrington South where the average price rose to £627,601, up by 24.9% on the year to September 2019. Photo: Google Streetview
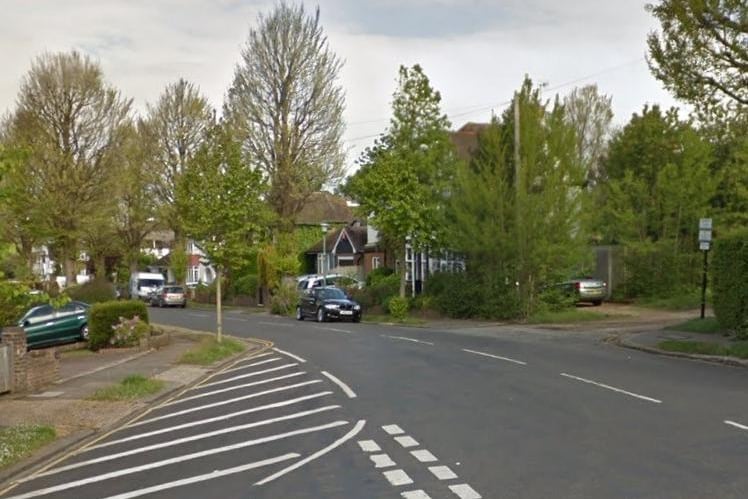
2.
The second biggest price hike was in Withdean Woods where the average price rose to £602,383, up by 15.7% on the year to September 2019. Photo: Google Streetview
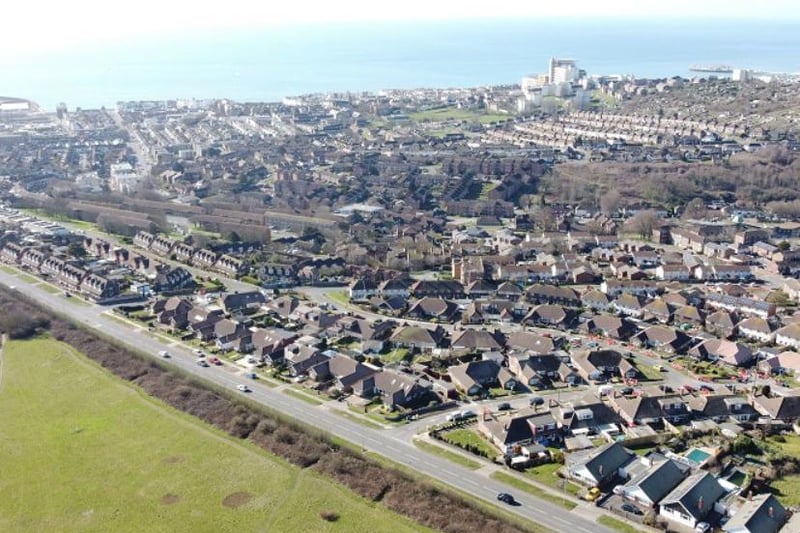
3.
The third biggest price hike was in Whitehawk where the average price rose to £343,121, up by 14.3% on the year to September 2019. Photo: Eddie Mitchell
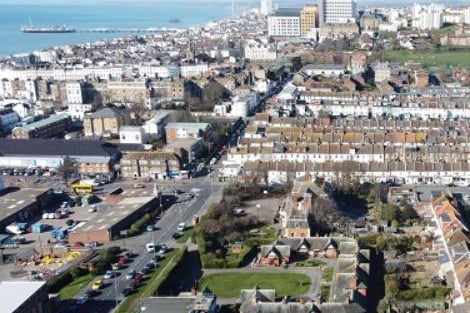
4.
The fourth biggest price hike was in Kemptown where the average price rose to £427,532, up by 10.7% on the year to September 2019. Photo: Eddie Mitchell