
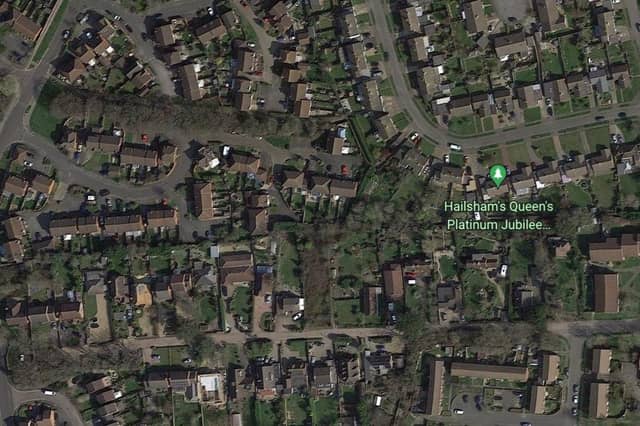

We’ve compiled a list of the neighbourhoods in Wealden with the lowest estimated average annual household income, based on the latest figures published by the Office for National Statistics. These are the areas which could be far less able to afford the rocketing cost of food and bills.
The ONS breaks Wealden down into 21 neighbourhoods called middle-layer super output areas (MSOA). The highest average income, according to the statistics, is Frant & Groombridge, while the lowest is Hailsham East.
The average income statistics are the latest available by neighbourhood, published by the Office for National Statistics in March 2020 and relating to the financial year ending 2018.
Total annual household income is the sum of the before-tax income of every member of the household, plus any income from benefits. The estimates were calculated by the ONS using various sources of information, including the 2011 Census and the annual Family Resources Survey.
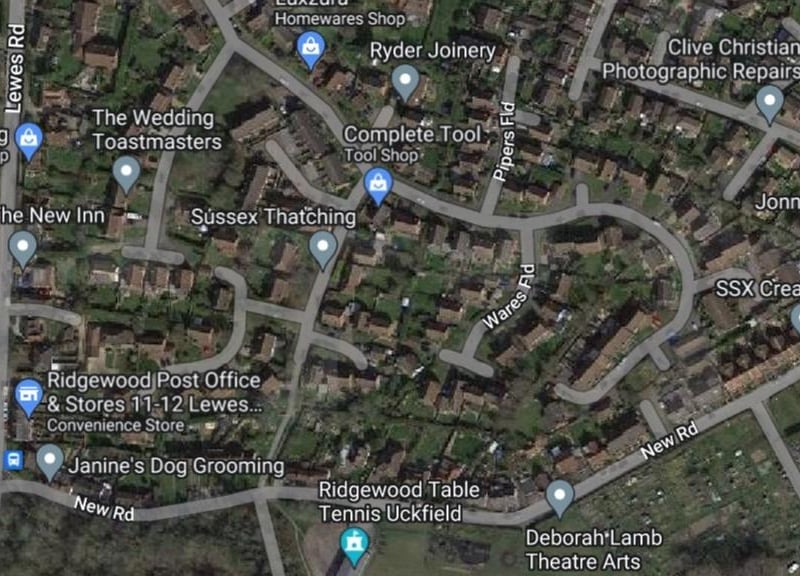
17. Uckfield South
Households in Uckfield South have an average annual income after tax of £49,900 Photo: Google
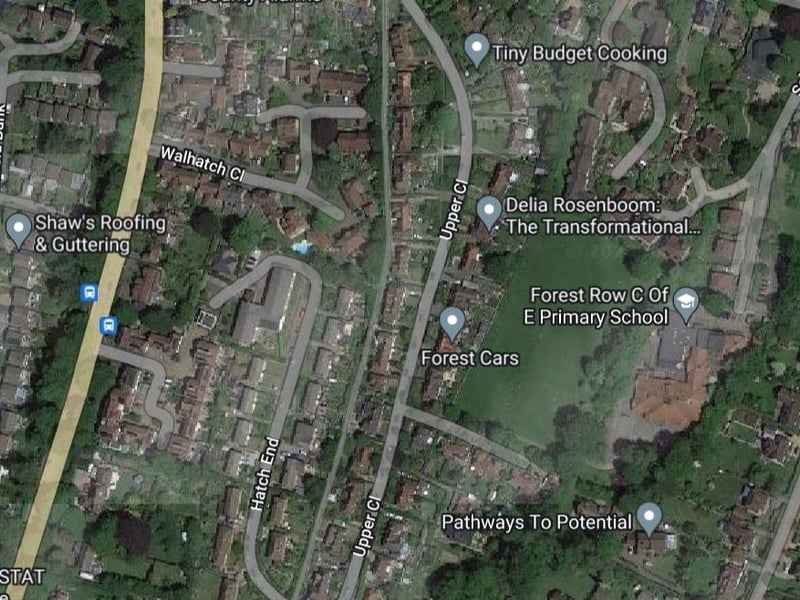
18. Forest Row & Coleman's Hatch
Forest Row & Coleman's Hatch households have an average annual income of £50,400 Photo: Google
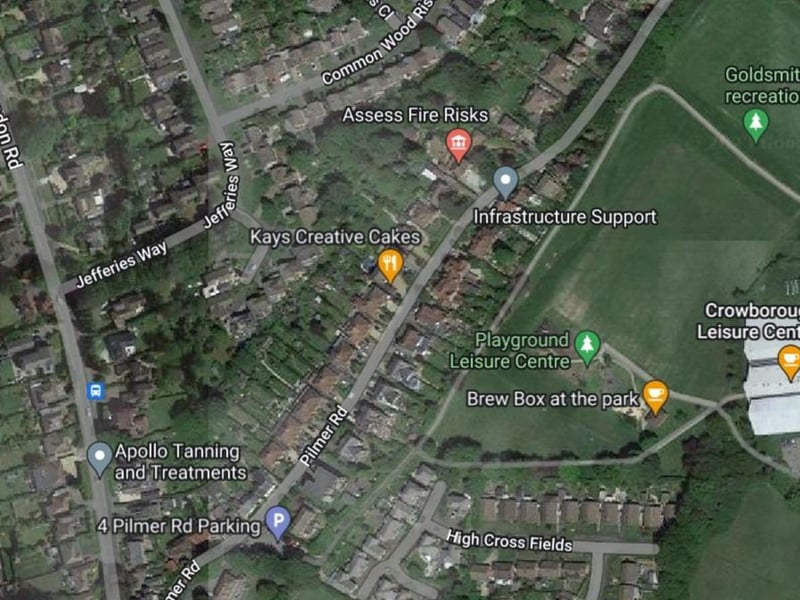
19. Crowborough North East
Households in Crowborough North East have an average annual income after tax of £51,600 Photo: Google
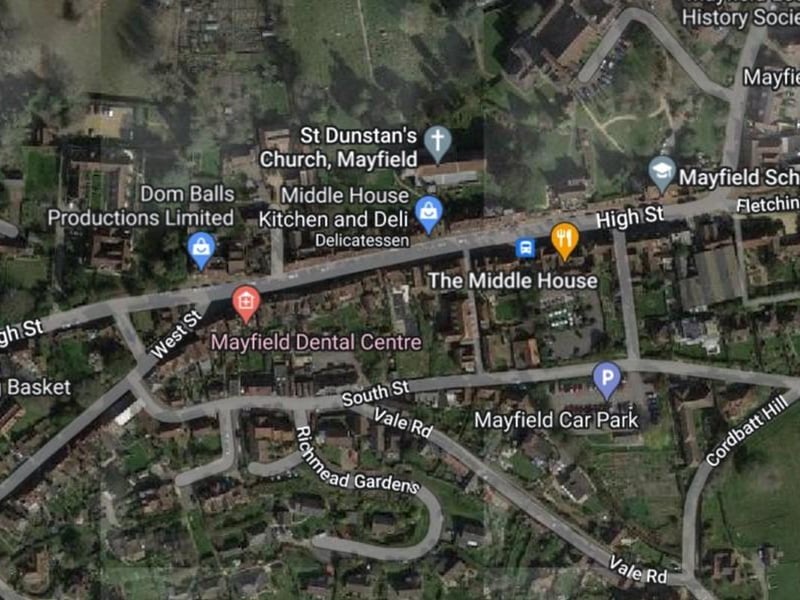
20. Mayfield & Wadhurst
Mayfield & Wadhurst is the second-richest neighbourhood in Wealden, with an average annual household income of £54,900 Photo: Google