There were 693,096 cases in the week ending January 27, a 0.8 per cent fall on the number seen the week before.
It is double the number of cases the UK saw in the last week of November, before the Omicron wave.
At neighbourhood level, Covid-19 case rates have been published for the week beginning January 20 to January 27
Here are the neighbourhoods in the Chichester District with the highest case rates right now.

1.
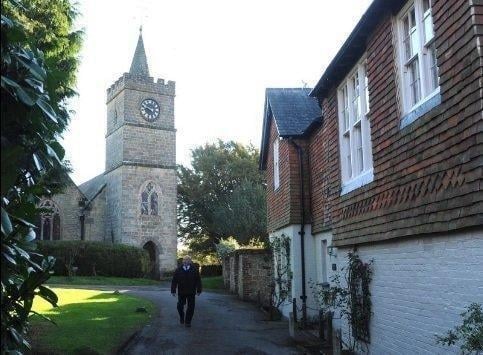
Fernhurst and Northchapel had 1091.8 Covid-19 cases per 100,000 people in the latest week, a drop 8.8 per cent from the week before.

2.
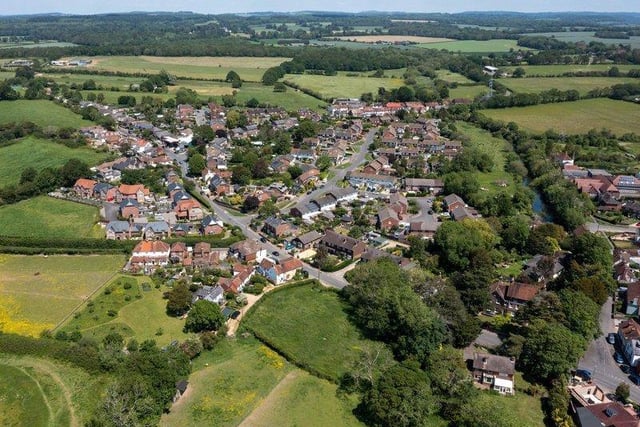
Westbourne and Funtington had 843.4 Covid-19 cases per 100,000 people in the latest week, a fall of 3.1 per cent from the week before.

3.
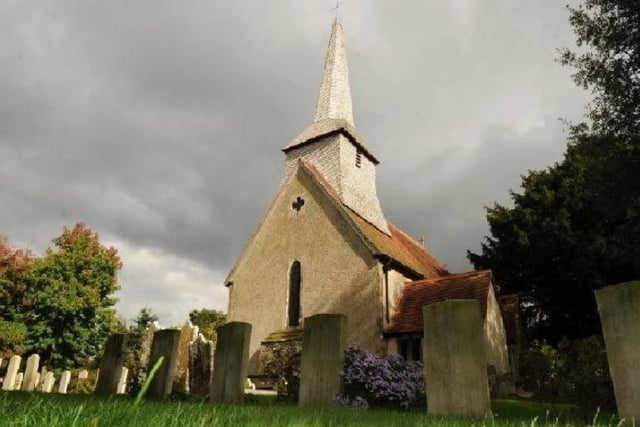
Tangmere, Mundham and Hunston had 768.1 Covid-19 cases per 100,000 people in the latest week, a drop of 29.1 per cent from the week before.

4.
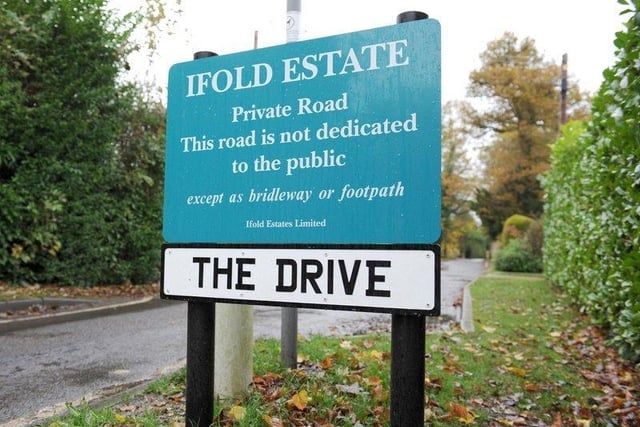
Ifold and Wisborough Green had 739.3 Covid-19 cases per 100,000 people in the latest week, a fall of 16.7 per cent from the week before.

