There were 634,026 cases in the week ending January 21, a 0.2% rise on the number seen the week before.
HAVE YOU SEEN? Sussex Daily Bulletin for 26.01.22 | 16 photos from Crawley' s past including Princess Diana visiting St Catherine's Hospice in 1988 | 16,000 homes in Crawley and Horley to benefit from £37.5 million investment by Openreach
It is double the number of cases the UK saw in the last week of November, before the Omicron wave.
The flat national picture disguises huge regional variations, with cases up by 26% in a week in Northern Ireland and 20% in the South East of England but down by 21% in Scotland and 15% in the North East.
Case numbers include positive lateral flow tests in England and Northern Ireland but exclude them in Scotland and Wales, making comparisons across the UK nations difficult.
At neighbourhood level, Covid-19 case rates have been published for the week to January 20.
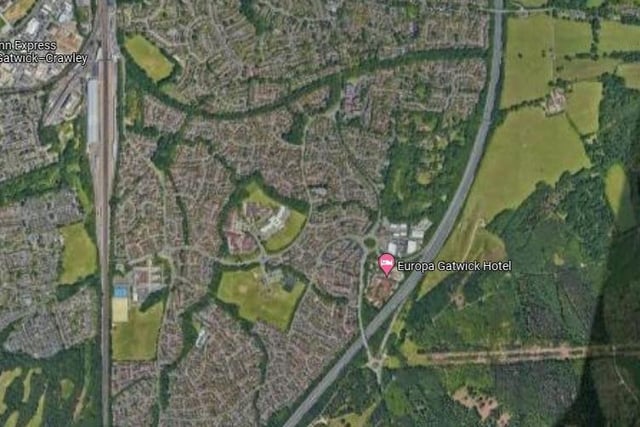
Here are the neighbourhoods in Crawley with the biggest rises and drops in case rates in the past week.

1. Maidenbower East and Worth
Maidenbower East and Worth had 1053 Covid-19 cases per 100,000 people in the latest week, a rise of 5.2% from the week before.

2. Southgate
Southgate had 917.9 Covid-19 cases per 100,000 people in the latest week, a rise of 36.5% from the week before.

3. Maidenbower West and Furnace Green
Maidenbower West and Furnace Green had 902.9 Covid-19 cases per 100,000 people in the latest week, a drop of 24.1% from the week before.

4. Pound Hill
Pound Hill had 830 Covid-19 cases per 100,000 people in the latest week, a drop of 30.6% from the week before.

