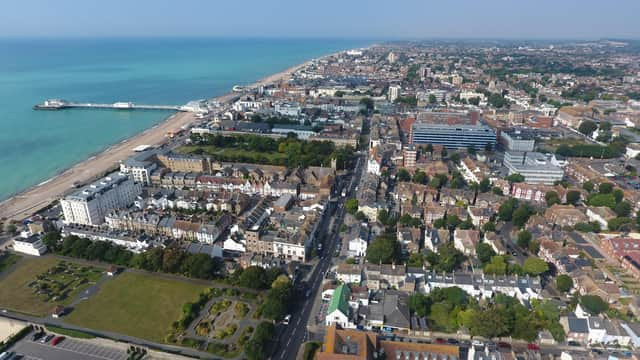
According to Public Health England, figures show that for the week ending January 29, Worthing had an infection rate of 266 cases per 100,000 people.
That is slightly above the national average of 249 per 100,000 people.
Within Worthing, all but two of the 14 neighbourhoods have seen their infection rates drop during the week ending January 28.
Here we reveal which neighbourhoods have seen the biggest decrease in case rates per between January 21 and January 28.
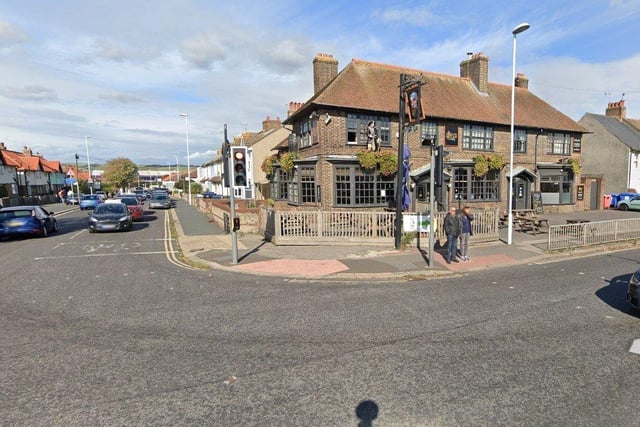
1. East Worthing - 488.4 cases per 100,000 people
East Worthing's infection rate rose by 5.4% in the week up to January 23 SUS-210129-141421001 Photo: Google
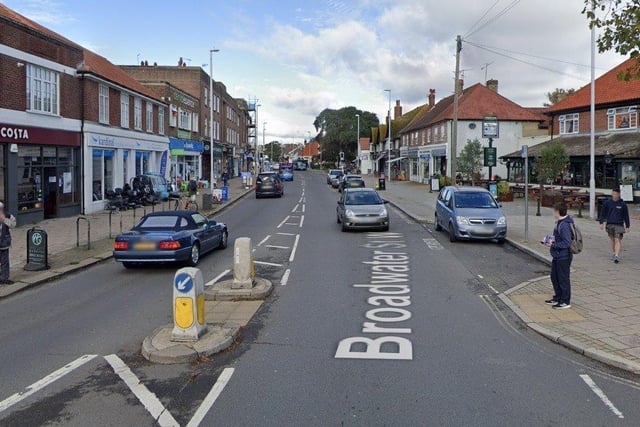
2. Broadwater South - 603 cases per 100,000 people
Broadwater South's infection rate rose by 1.8% in the week up to January 23 SUS-210129-141606001 Photo: Google
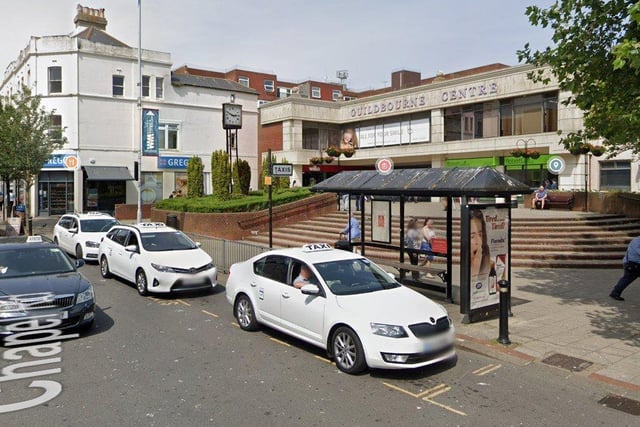
3. Worthing Central - 466.6 cases per 100,000 people
Worthing Central's infection rate fell by 9.4% in the week up to January 23 SUS-210129-141555001 Photo: Google
4. Goring - 457.8 cases per 100,000 people
Goring's infection rate fell by 24.5% in the week up to January 23 SUS-210129-141505001 Photo: Google
