

The current BA.2 wave has seen case rates hit the second-highest level in the pandemic so far, after the Omicron wave of the past winter.
Across the UK, hospitalisations are at about half the numbers seen at their peak, in January, 2021, while the number of deaths is well below those seen before the vaccine rollout.
The lifting of many restrictions, waning effectiveness of boosters and the spread of the highly contagious BA.2 ‘stealth Omicron’ variant have all been touted as potential reasons for the current wave.
At neighbourhood level, Covid-19 case rates have been published by the government for the week to March 24 – here are the figures for all the town’s neighbourhoods.
But there is a caveat – changes in testing rules mean a number of positive cases might not have been reported.
Today, April 1, sees the rules change again: most people are now ineligible for free tests and those with Covid-19 are no longer legally required to self-isolate – although the government advises people to stay at home and avoid others for at least five days.
The lifting of many restrictions, waning effectiveness of boosters and the spread of the highly contagious BA.2 ‘stealth Omicron’ variant have all been touted as potential reasons for the current wave.
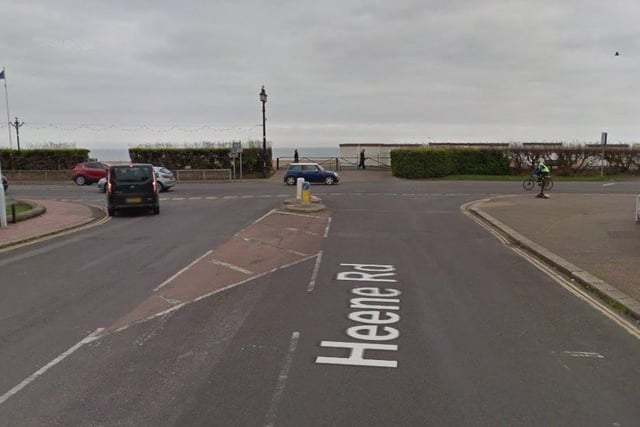
5. Heene: 1,083.8 cases per 100,000 people
Heene's infection rate fell by 8.6 per cent in the week to March 24 Photo: Google
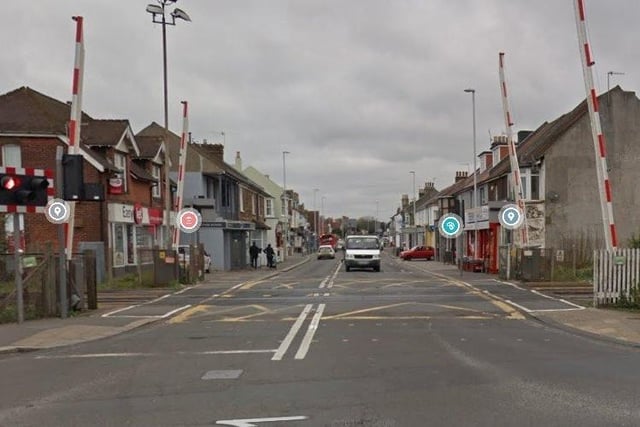
6. Durrington North: 1,244.9 cases per 100,000 people
Durrington North's infection rate fell by 4.8 per cent in the week to March 24 Photo: Google
7. West Worthing: 1,085.1 cases per 100,000 people
West Worthing's infection rate fell by 3.3 per cent in the week to March 24 Photo: Google
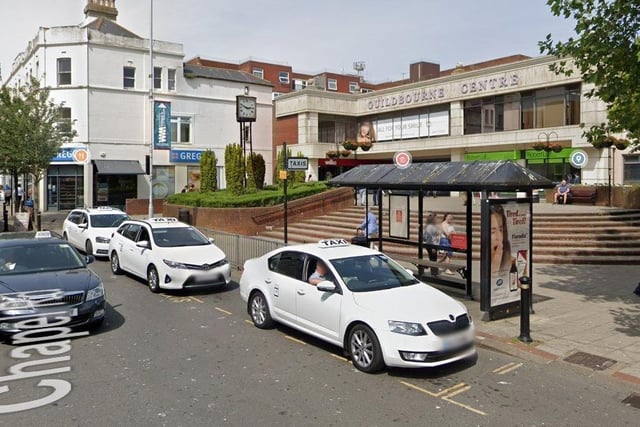
8. Worthing Central: 1,132.7 cases per 100,000 people
Worthing Central's infection rate rose by 1.8 per cent in the week to March 24 Photo: Google