Some parts of England have seen house prices rocket by as much as 50% or more in just a year, analysis of official figures shows.
Almost three quarters of neighbourhoods in England saw an increase in property prices in the year to September 2022, but some have seen hundreds of thousands of pounds added onto the average sale price.
Property price data published in the UK House Price Index (HPI) shows the average price for a home in England was £312,513 in September 2022, a 9% increase on the previous year when the average property cost £286,832.
The Office for National Statistics publishes localised house price figures, based on the HPI, breaking England into 6,809 neighbourhoods known as middle-layer super output areas.
In total 71% of these neighbourhoods in England saw an increase in average house prices, with 12 recording at least a 50% rise, in the year to September 2022.
As the figures cover small areas, average house prices can fluctuate due to low sales numbers and can be heavily influenced by factors such as a new development in the area.
Here we reveal which neighbourhoods in Brighton and Hove have seen the greatest increase in property prices in the last year. Images are for illustrative purposes only.
. House prices in Brighton and Hove: The 33 neighbourhoods with the fastest rising prices
People wanting to buy a home in an up-and-coming part of Brighton and Hove can find out which areas to look at, thanks to new figures. Photo: I-Wei Huang - stock.adobe.com
. West Blatchington - price increased 23.9%
The median property price in West Blatchington was £650,000 in September 2021. This increased to £805,400 over 12 months. This is a £155,400 increase. Photo: Google
. Hollingbury - price increased 23.2%
The median property price in Hollingbury was £527,500 in September 2021. This increased to £650,000 over 12 months. This is a £122,500 increase. Photo: Google
. Coldean & Moulsecoomb North - price increased 17.6%
The median property price in Coldean & Moulsecoomb North was £336,000 in September 2021. This increased to £395,000 over 12 months. This is a £59,000 increase. Photo: Google
. Patcham East - price increased 16.2%
The median property price in Patcham East was £430,000 in September 2021. This increased to £499,750 over 12 months. This is a £69,750 increase. Photo: Google
. Mile Oak - price increased 15%
The median property price in Mile Oak was £317,500 in September 2021. This increased to £365,000 over 12 months. This is a £47,500 increase. Photo: Google
. Hangleton South - price increased 12.7%
The median property price in Hangleton South was £426,000 in September 2021. This increased to £480,000 over 12 months. This is a £54,000 increase. Photo: Google
. Fiveways - price increased 12.4%
The median property price in Fiveways was £570,000 in September 2021. This increased to £640,750 over 12 months. This is a £70,750 increase. Photo: Google
. Goldsmid West - price increased 9.3%
The median property price in Goldsmid West was £350,000 in September 2021. This increased to £382,500 over 12 months. This is a £32,500 increase. Photo: Google
. Portslade Village - price increased 8.8%
The median property price in Portslade Village was £340,000 in September 2021. This increased to £370,000 over 12 months. This is a £30,000 increase. Photo: Google
. Goldsmid East - price increased 8.3%
The median property price in Goldsmid East was £337,500 in September 2021. This increased to £365,500 over 12 months. This is a £28,000 increase. Photo: Google
. Hollingdean & Moulsecoomb West - price increased 8.2%
The median property price in Hollingdean & Moulsecoomb West was £335,000 in September 2021. This increased to £362,500 over 12 months. This is a £27,500 increase. Photo: Google
. Woodingdean - price increased 6.6%
The median property price in Woodingdean was £415,000 in September 2021. This increased to £442,500 over 12 months. This is a £27,500 increase. Photo: Google
1. House prices in Brighton and Hove: The 33 neighbourhoods with the fastest rising prices
People wanting to buy a home in an up-and-coming part of Brighton and Hove can find out which areas to look at, thanks to new figures. Photo: I-Wei Huang - stock.adobe.com
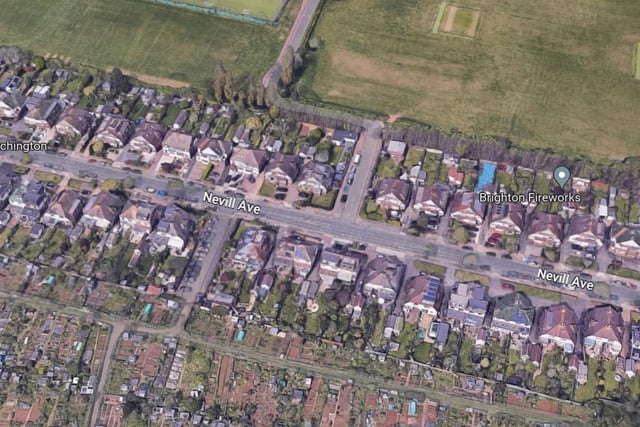
2. West Blatchington - price increased 23.9%
The median property price in West Blatchington was £650,000 in September 2021. This increased to £805,400 over 12 months. This is a £155,400 increase. Photo: Google
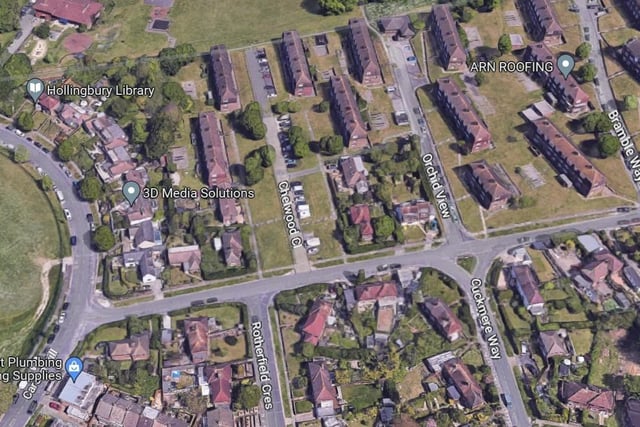
3. Hollingbury - price increased 23.2%
The median property price in Hollingbury was £527,500 in September 2021. This increased to £650,000 over 12 months. This is a £122,500 increase. Photo: Google
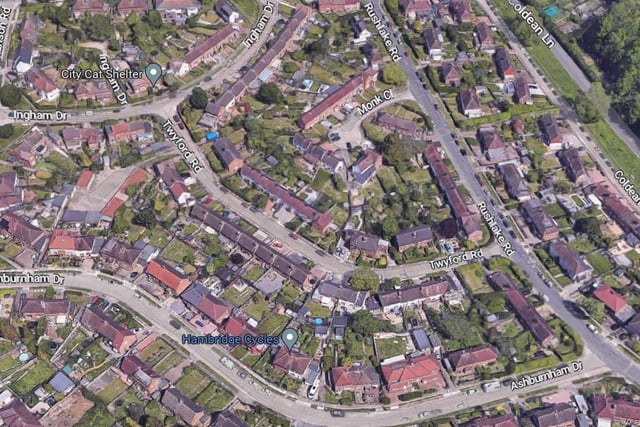
4. Coldean & Moulsecoomb North - price increased 17.6%
The median property price in Coldean & Moulsecoomb North was £336,000 in September 2021. This increased to £395,000 over 12 months. This is a £59,000 increase. Photo: Google