

One of its results is a measure of household deprivation. By comparing the scores from the 2011 census with those from the 2021 census, we can see which neighbourhoods are less deprived than they were before.
There are lots of possible ways to measure household deprivation, and the method used by the Office for National Statistics doesn’t take income into account.
Instead, it looks at four different measures: unemployment, low qualification levels, poor health and bad housing.
Across England and Wales as a whole, more than half of households (52%) were deprived in at least one of these four possible ways when the census took place in 2021 - that’s 12.8 million households.
But this is a fall from the decade before, when the figure was 58%.
The census also divides England and Wales into more than 7,000 smaller areas of between 5,000 and 15,000 residents, called middle-layer super output areas.
For each of these areas, it publishes how many households were deprived in at least one of its four measures.
Here are the areas of Wealden where the proportion of deprived households fell the most between 2011 and 2021.
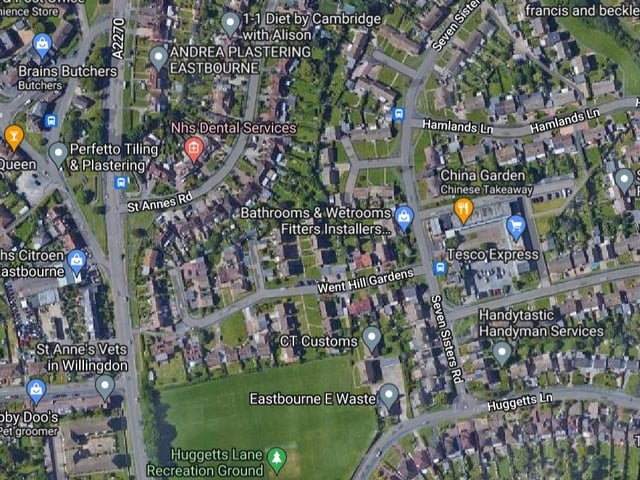
5. Willingdon
In the Willingdon area, 46.2% of households were not deprived in 2021, an improvement on 2011 when the figure was 40.9%. Photo: Google
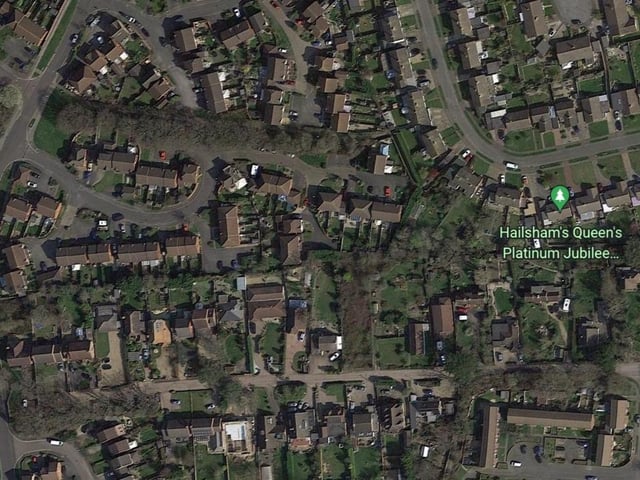
6. Hailsham East
In the Hailsham East area, 37.7% of households were not deprived in 2021, an improvement on 2011 when the figure was 32.4%. Photo: Google
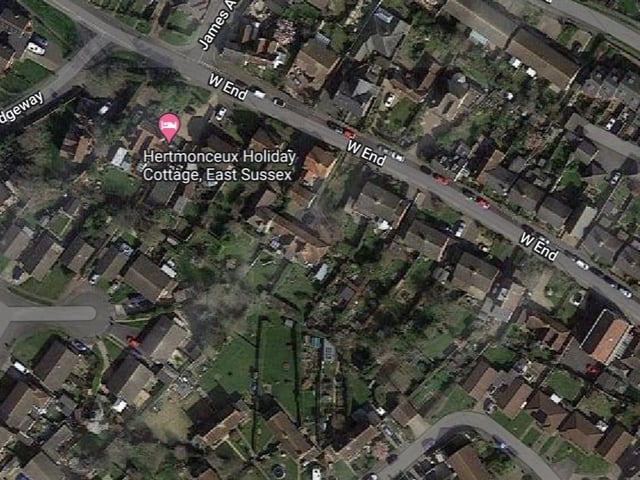
7. Herstmonceux & Ninfield
In the Herstmonceux & Ninfield area, 52.7% of households were not deprived in 2021, an improvement on 2011 when the figure was 47.6%. Photo: Google
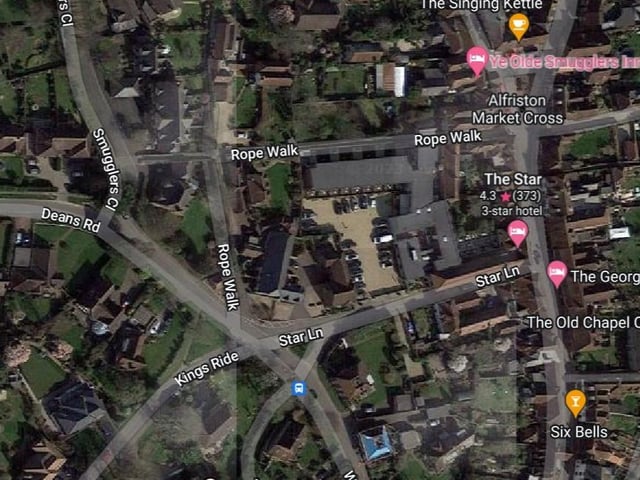
8. Hailsham North, Alfriston & East Dean
In the Hailsham North, Alfriston & East Dean area, 53.3% of households were not deprived in 2021, an improvement on 2011 when the figure was 48.3%. Photo: Google