All 13 areas are reviewed here with all the data provided.
1.
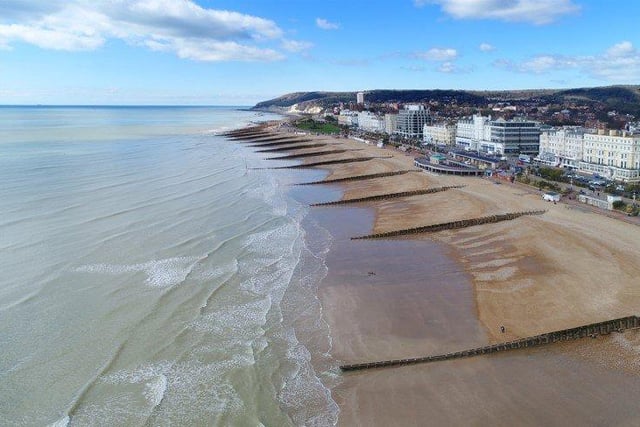
Eastbourne. SUS-211116-140728001
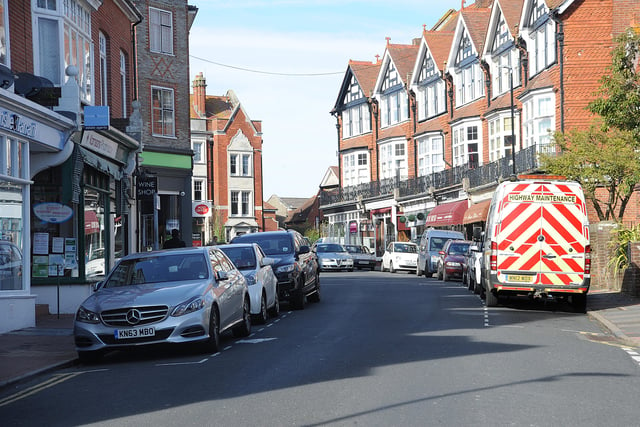
2.
Old Town & Motcombe was the area with the highest total case rates and the fastest increase in covid rates. Rate of cases per 100,000, week to 16 December: 449. Rate of cases per 100,000, week to 23 December: 1019.4. % change: 127.0%
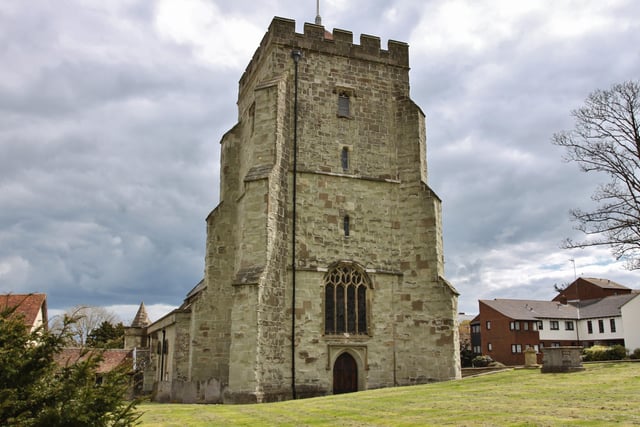
3.
Meads. Rate of cases per 100,000, week to 16 December: 345.9. Rate of cases per 100,000, week to 23 December: 678.0. % change: 96.0%.
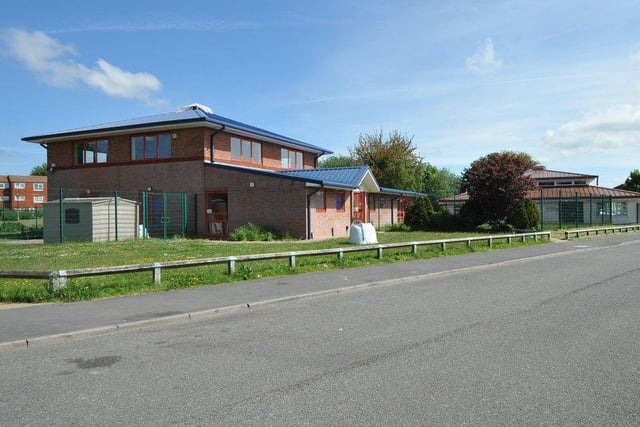
4.
Hampden Park North had the second highest total case rate and the third fastest rising case rate. Rate of cases per 100,000, week to 16 December: 486.9. Rate of cases per 100,000, week to 23 December: 935.3. % change: 92.1%%
1 / 4