
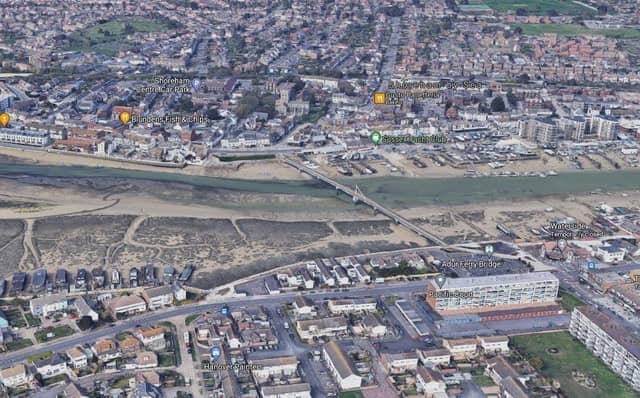

But despite that, average house prices held up across England – even if there was a drop in sales.
It was the same picture in Adur, where prices rose by 4.9 per cent in the year to September 2020. Across the South East, prices rose by 3.4 per cent.
The ONS also publishes house price figures by Middle Layer Super Output Areas (MSOAs) – small geographic areas containing an average of 7,200 people.
These show six of the eight MSOAs that make up Adur saw a rise in house prices over the same period.
Here we reveal which neighbourhoods saw the strongest growth in the year to September 2020.
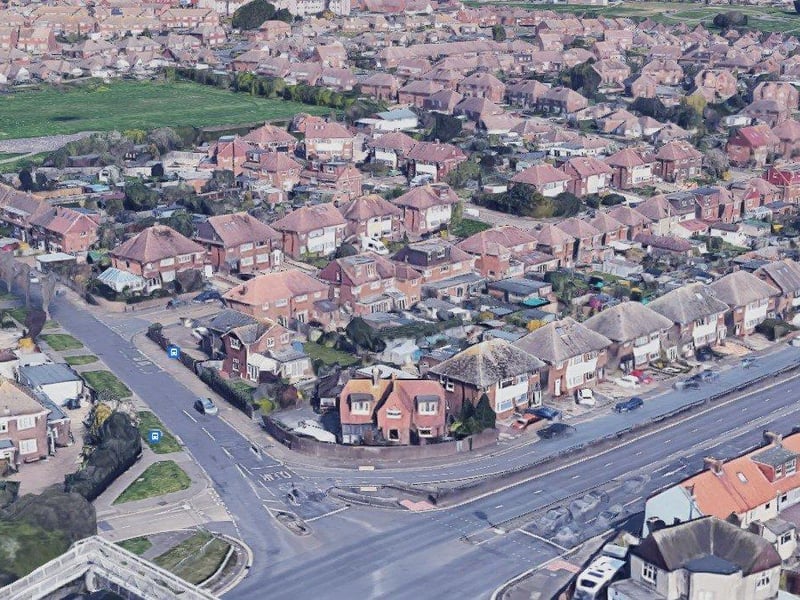
5. Hillside, Shoreham
The fifth biggest price increase was in Hillside in Shoreham, where the average price rose to £365,766, up by 2.7% on the year to September 2019. Overall, 100 homes changed hands here between October 2019 and September 2020, a drop of 22%. Photo: Google
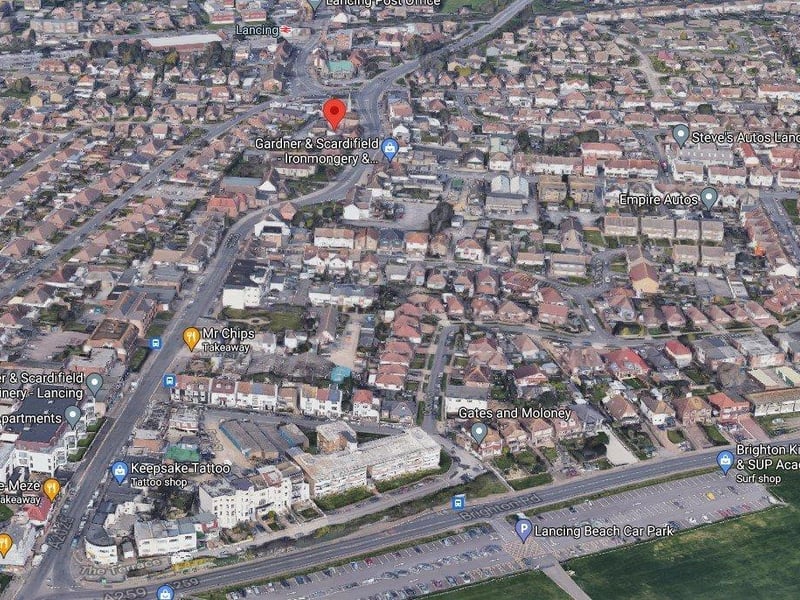
6. South Lancing
The sixth biggest price increase was in South Lancing, where the average price rose to £265,816, up by 2% on the year to September 2019. Overall, 132 homes changed hands here between October 2019 and September 2020, a drop of 9%. Photo: Google
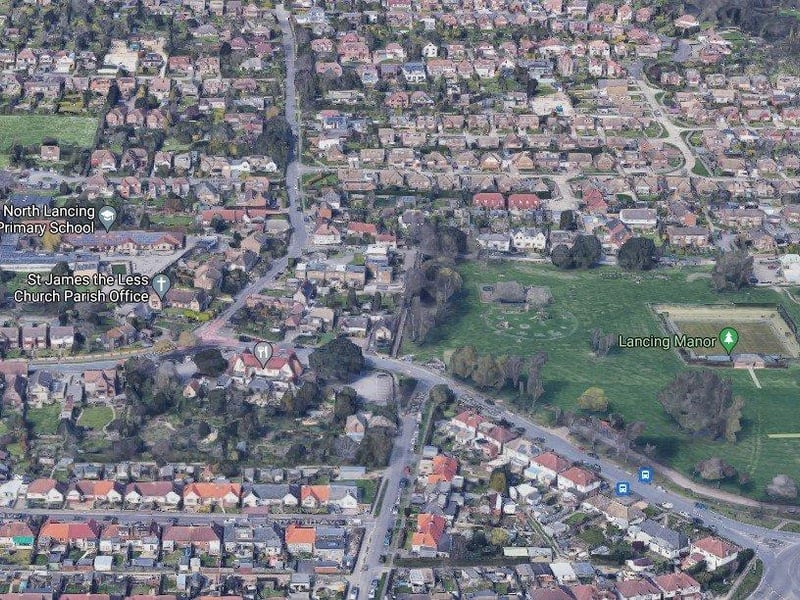
7. North Lancing
The smallest price decrease was in North Lancing, where the average price fell to £325,051, down by 2.6% on the year to September 2019. Overall, 89 homes changed hands here between October 2019 and September 2020, a drop of 12%. Photo: Google
8. Mash Barn and Widewater
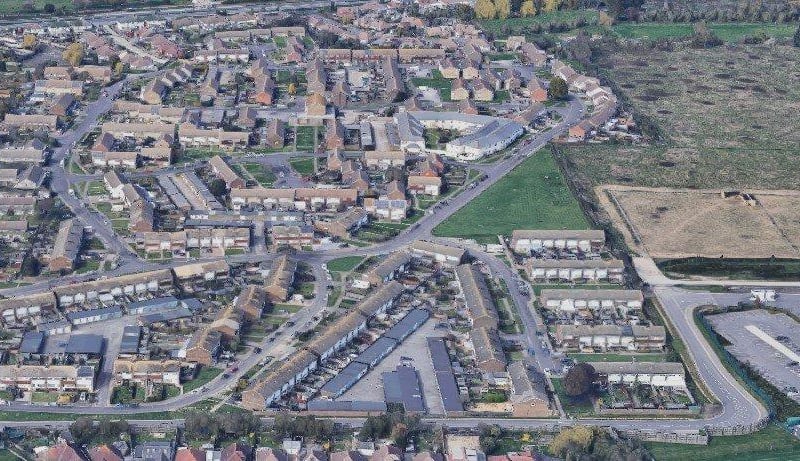
The biggest price decrease was in Mash Barn and Widewater, where the average price fell to £313,013, down by 3.7% on the year to September 2019. Overall, 56 homes changed hands here between October 2019 and September 2020, a drop of 22%. Photo: Google