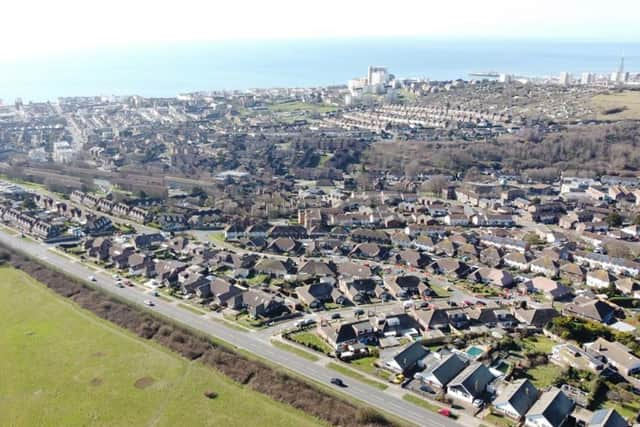
Brighton and Hove areas where Covid infections rose the fastest in the past week
and live on Freeview channel 276
According to UK Government statistics, the Brighton neighbourhood's rate of cases per 100,000 was 2009.04 at the end of December 30, a 78% increase from the week prior.
Portsalde (44.3%), Rottingdean (18.3%), Bevendean (18%) and Hollingbury (16.3%) make up the top 5 neighbourhoods with the fastest rise in infection rates.
Advertisement
Hide AdAdvertisement
Hide AdThe Omicron variant continues to cause coronavirus infection rates to hit record levels in the UK.


There were 1.07 million positive test results in the week to December 30, up 34% from the week before, official figures show.
However, the statistics also show that of the 34 neighbourhoods in Brighton and Hove, 21 had seen their rate of cases drop in the past two weeks.
Preston Park saw a 21% decrease in its rate of cases per 100,000 – dropping from 1901.5 cases to 1351.7.
Advertisement
Hide AdAdvertisement
Hide AdKemptown (24%), Round Hill (23.5%), Aldrington South (21.2%) and Hanover (18.6%) make up the top 5 neighbourhoods with the greatest decrease in infection rates.
READ MORE: