
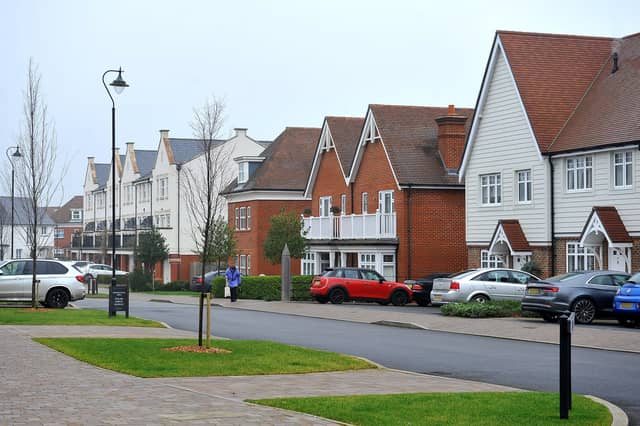

We have explained the background behind how these figures are calculated – and what they mean in detail – in our explainer here
In this piece, where possible, we have recorded details for each area in three categories.
Local plan status refers to when the council’s local plan was approved – and its current status. Local plans are generally reviewed after five years but some councils have put theirs on pause due to uncertainties over national policy.
Local plan housing requirement details the target the council set out to deliver when its plan was approved.
And government housing need is the figure the government’s Standard Method calculation says is needed in a given area to meet the need for new homes.
When reviewing their local plans, councils will have to take this figure into account, meaning many are likely to have to find new sites for development.
New data was released on Wednesday (March 23) which could affect the Standard Method figures – these will be updated by councils in due course.
See more about our housing campaign here
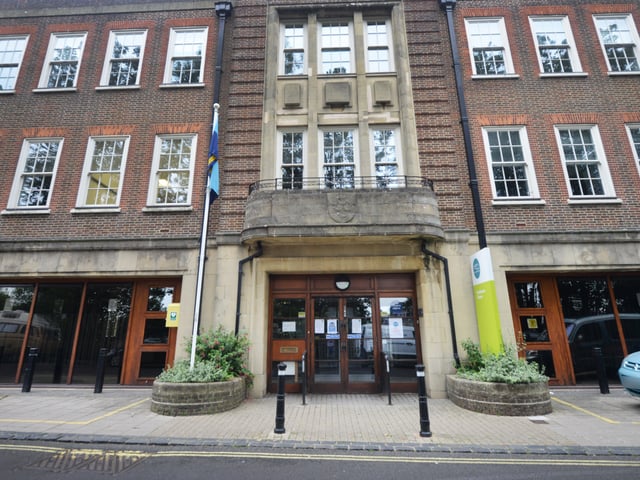
9. Lewes
Local plan status: Part one adopted 2016, part two adopted 2020. Local plan housing requirement: 345 homes a year. Government housing need: Unconfirmed SUS-210823-125317001
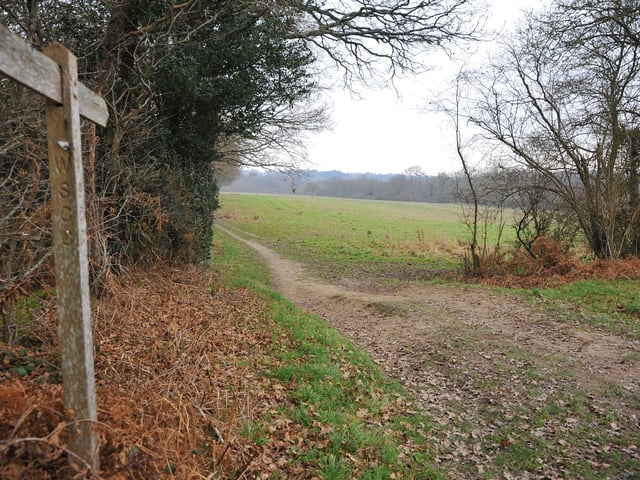
10. Mid Sussex
Local plan status: Adopted 2018, review on pause. Local plan housing requirement: 964 homes a year. Government housing need: 1,093 a year. SUS-220117-095131001
11. Rother
Local plan status: Adopted 2014, being updated. Local plan housing requirement: 335 homes a year. Government housing need: 740 homes a year. Photo: atex.scriptmanager
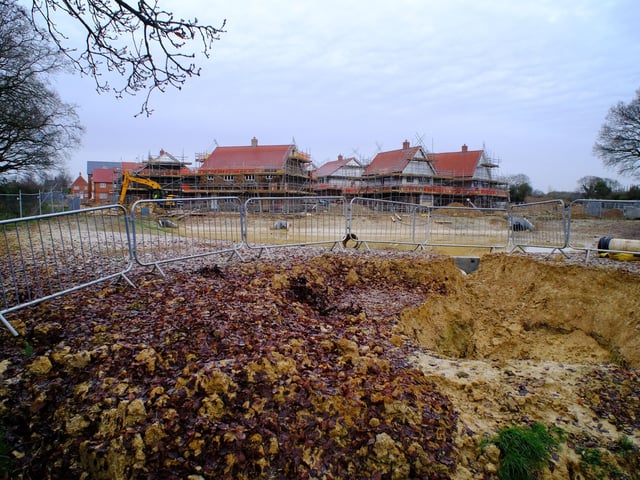
12. Wealden
Local plan status: Adopted 2013, being updated. Local plan housing requirement: 450 homes a year. Government housing need: 1,221 a year. SUS-200901-065113008 Photo: Hilsea Portsmouth