DVLA data reveals the most common driving offences in Britain - the area with the most offenders
and live on Freeview channel 276
New data from the Driver and Vehicle Licensing Agency (DVLA) has revealed the most common driving offence committed in Britain, and which area in the UK breaks the most driving laws.
Data gained through a Freedom of Information request made by Scrap Car Comparison, highlights which regions break the most road laws, with the south east leading the way, above London and the North West.
Advertisement
Hide AdAdvertisement
Hide AdData from the government shows over 70 per cent of adults in the UK hold a valid driving licence. The data shows that speed accounts for 67 per cent of the points currently on driving licences within Britain.
Driving while using a mobile phone is also high on the list of the most common driving offences in the UK. This is most likely due to tighter restrictions coming into place around phone usage in March 2022.
Dan Gick, managing director of Scrap Car Comparison said : “Taking a look at this unique data to understand how we’re breaking the law on the roads has uncovered some very interesting trends.
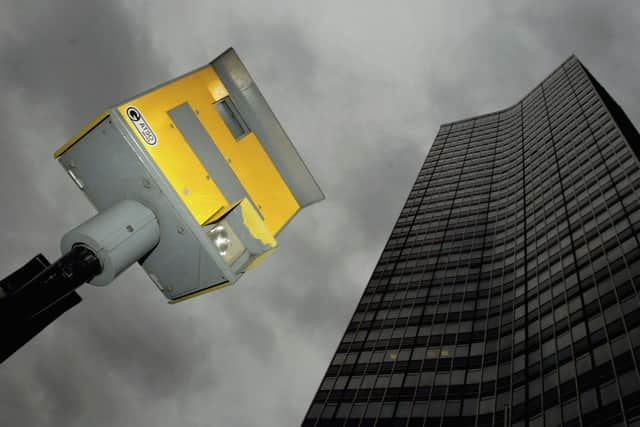
“As we all know thanks to the number of speed cameras and speed camera vans spotted on the road, drivers breaking the speed limit is a continual problem that we’re facing on the roads.
Advertisement
Hide AdAdvertisement
Hide Ad“It’s surprising to see driving with a defective tyre also in the top ten offences, as it’s so easy to prevent - we can all spare a few seconds before getting into our cars to check that our tyre walls are in good order, and that we have sufficient tread depth. There really aren’t any excuses for this one.”
Most common driving offences in Britain
1 - Exceeding statutory speed limit on a public road - 3,028,699


2 - Exceeding speed limit on a motorway - 627,796
3 - Using a vehicle uninsured against third party risks - 288,424
4 - Failure to give information as to identity of driver etc - 155,869
5 - Exceeding goods vehicle speed limits - 86,385
Top 10 regions where the most drivers have picked up points
- South East England - 392,673 drivers
- London - 340,011 drivers
- North West England - 320,292 drivers
- Yorkshire and the Humber - 284,793 drivers
- East England - 280,749 drivers
- South West England - 275,474 drivers
- West Midlands - 271,705 drivers
- East Midlands - 270,978 drivers
- North East England - 109,469 drivers
- West Scotland - 78,310 drivers
Comment Guidelines
National World encourages reader discussion on our stories. User feedback, insights and back-and-forth exchanges add a rich layer of context to reporting. Please review our Community Guidelines before commenting.
