Census 2021: Crawley has ageing population


Crawley has an ageing population, new Census figures outline, as the proportion of over-65s calling the area home rose in the last decade.
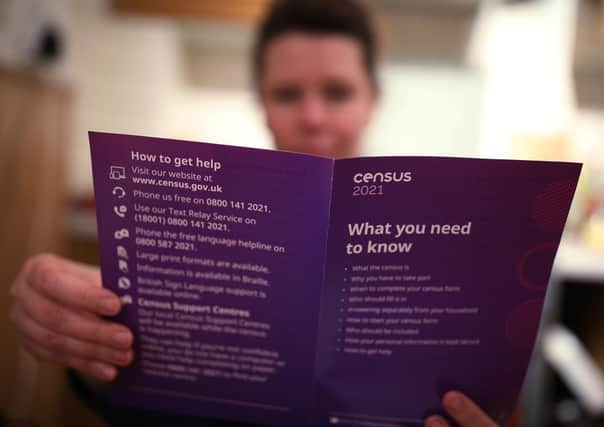
The Census takes place every 10 years, with the latest snapshot captured on March 21 2021.
Advertisement
Hide AdAdvertisement
Hide AdFigures published by the Office for National Statistics show there were 15,700 people aged 65 and over living in Crawley on census day last year – up from 13,468 in 2011, when the Census was last carried out.
It means the proportion of over-65s living in the area rose over the last decade – from 12.6% to 13.2%.
There were 45,200 people aged 29 and under living in Crawley on March 21 last year, who accounted for 38.1% of the population – up from 42,880 (40.2%) in 2011.
Of them, 15,700 under-10s called Crawley home.
This trend is reflected across England and Wales as a whole, where the population is ageing.
Advertisement
Hide AdAdvertisement
Hide AdThere were 11.1 million over-65s in 2021 – 18.6% of the population – up from 9.2 million in 2011 (16.4%) and 7.3 million (15.0%) 40 years ago.
Data from the 2021 census for England and Wales will be published in stages over the next two years, the ONS said.
Future releases will include figures on ethnicity, religion, the labour market, education and housing plus – for the first time – information on UK armed forces veterans, sexual orientation and gender identity.
The census was taken at a time when coronavirus restrictions were still in place across the UK, with people only allowed to leave their homes in England for recreation and exercise outdoors with their household or support bubble, or with one person outside their household, and the rule-of-six on outside gatherings not coming into place until the end of March.
Advertisement
Hide AdAdvertisement
Hide AdThe Census, which is used to understand how the UK's population changes over time, shows the balance of men and women across the country.
In Crawley, 49.8% of the population was male and 50.2% was female last year – respectively, this compares to 49.4% and 50.6% 10 years ago.
The City of London (55.8%) had the highest male-to-female ratio, while Kensington and Chelsea (46.7%) had the lowest.