


There were 579,638 cases in the week ending February 03, a 16 per cent fall on the number seen the week before.
It is still nearly double the number of cases the UK saw in the last week of November, before the Omicron wave hit.
Not all neighbourhoods in the Chichester district are seeing a drop in infection rates.
At neighbourhood level, Covid-19 case rates have been published to show data from January 27 to February 3.
Here are the neighbourhoods in the Chichester district with the biggest rise in case rates in the past week.
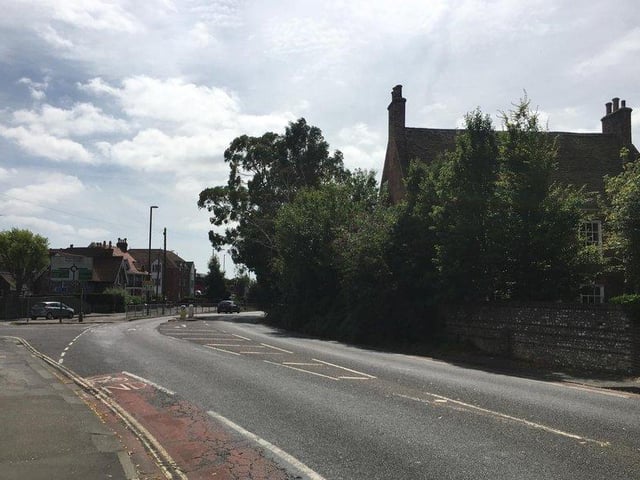
5.
Stockbridge and Fishbourne had 1118.6 Covid-19 cases per 100,000 people in the latest week, a rise of 6.1 per cent from the week before.
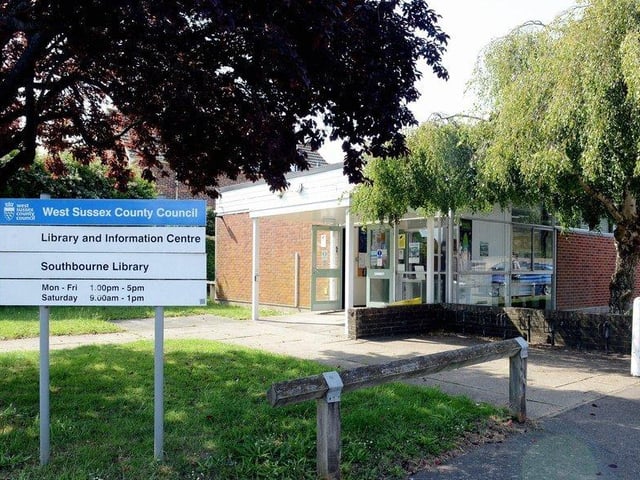
6.
Southbourne, Bosham and Thorney had 1080.3 Covid-19 cases per 100,000 people in the latest week, a rise of 3.3 per cent from the week before.
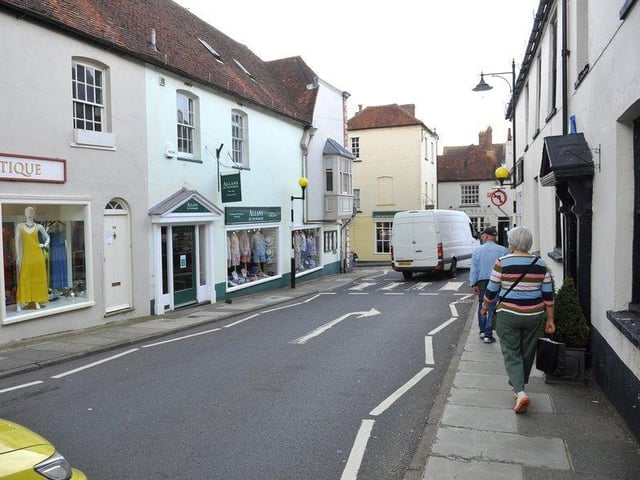
7.
Easebourne and Petworth had 1918.3 Covid-19 cases per 100,000 people in the latest week, a rise of 2.7 per cent from the week before.
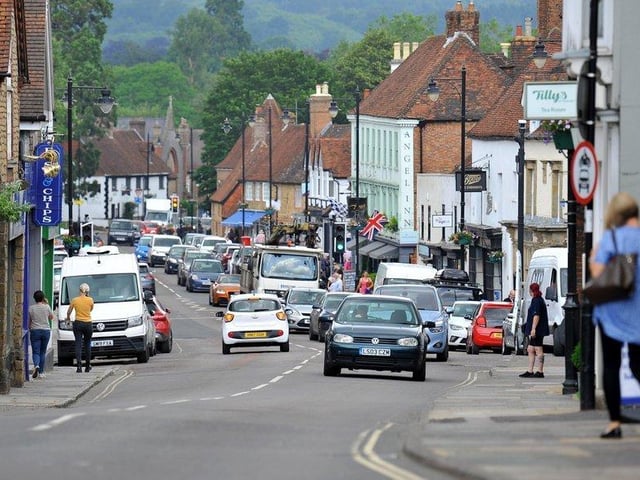
8.
Midhurst and Cocking had 1479.9 Covid-19 cases per 100,000 people in the latest week, a rise of 1.7 per cent from the week before.