
Brighton and Hove named in top 20 worst places in the UK for bike theft, according to new study
Cycling has long been a favourite mode of transport across the UK: it's cheap, green, and often faster than sitting in traffic. But whether you're pedalling to lectures, commuting to work, or heading out for a scenic ride, there's one nagging fear most cyclists share: will your bike still be there when you get back? The risk of bike theft is, unfortunately, a growing reality. With more people hopping on two wheels, the opportunities for thieves have multiplied, too. But have you ever wondered which cities in the UK are the worst for bike theft in 2025?
To shed light on the problem, the research team at VelociRAX, a company that specialises in bike racks, looked at the numbers to pinpoint the areas where bicycle theft is most common. The study used the latest figures from the Office for National Statistics (ONS) to calculate theft rates per 1,000 people.
Their methodology involved analysing recorded crime data specifically on bicycle thefts, covering 301 cities across the UK. Each city was ranked from the worst to the best based on how many thefts occurred relative to the population size, giving a clear picture of where cyclists are most at risk.
Brighton and Hove ranks 20th in the UK for bike theft, with 2.7 incidents per 1,000 people. With its vibrant mix of students, tourists, and coastal commuters, cycling is a popular choice through the city’s compact streets and along the seafront. Still, high footfall in areas like the Lanes, North Laine, and around Sussex University creates plenty of opportunity for thieves. Bike parking spaces are often at a premium, and inadequate locking can turn a quick café stop or beach walk into the last time you see your bike.
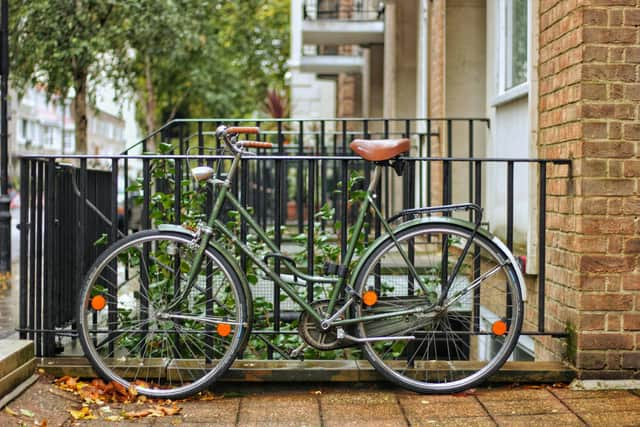

Meanwhile, Cambridge ranks as the UK’s worst city for bike theft, with 8.8 incidents per 1,000 people, likely driven by its student population and widespread cycling culture. Oxford comes next at 6.7, followed by Hammersmith and Fulham (5.8), Westminster (5.5), and Hackney (5.1), all areas where cycling is popular but secure parking remains limited.
Camden and York share sixth place with 4.4 thefts per 1,000, while Cardiff and Tower Hamlets are tied in eighth with 3.8. Kensington and Chelsea rounds out the top 10 at 3.6, proving that even wealthier boroughs aren’t immune to opportunistic bike thieves.
At the opposite end of the spectrum, the Isles of Scilly is the safest spot in the UK for bike owners, reporting a grand total of zero thefts. Meanwhile, areas such as South Staffordshire, Pembrokeshire, Rutland, and Staffordshire Moorlands all recorded just 0.1 thefts per 1,000 people, making them some of the most secure places to park your bike.
Other notable entries include Burnley in 150th place with 0.6 thefts per 1,000 people, Sheffield in 126th with 0.7, and Sunderland in 88th with 1.0. Cities like Milton Keynes, Swansea and Liverpool all hovered around 1.1, placing them closer to the middle of the pack. Meanwhile, Blackpool and Leeds sat side by side in 55th and 56th place, both at 1.4.
Further up the risk ladder, Newcastle upon Tyne and Portsmouth placed 33rd and 34th respectively, each recording 1.9 thefts per 1,000 people. Nottingham followed in 28th at 2.0, and Manchester made the top 25 at 2.3 thefts per 1,000, not quite among the worst, but certainly not risk-free either.
Top 20 list of the cities with the most bicycle thefts:
| Rank | Local Authority name | Bicycle theft per 1,000 people |
| 1 | Cambridge | 8.8 |
| 2 | Oxford | 6.7 |
| 3 | Hammersmith and Fulham | 5.8 |
| 4 | Westminster | 5.5 |
| 5 | Hackney | 5.1 |
| 6 | Camden | 4.4 |
| 6 | York | 4.4 |
| 8 | Cardiff | 3.8 |
| 8 | Tower Hamlets | 3.8 |
| 10 | Kensington and Chelsea | 3.6 |
| 11 | Islington | 3.4 |
| 12 | Southwark | 3.3 |
| 13 | Reading | 3.1 |
| 14 | Richmond upon Thames | 3.0 |
| 14 | Norwich | 3.0 |
| 16 | Lincoln | 2.8 |
| 16 | Kingston upon Hull, City of | 2.8 |
| 20 | Kingston upon Thames | 2.7 |
| 20 | Brighton and Hove | 2.7 |
| 20 | Cheltenham | 2.7 |