


Data shows the number of places on offer each year, the number of first preference applications (1st pref), and the number of first preferences allocated (1st pref given).
Allocation numbers include late applications and preference numbers do not, this is why some allocations numbers are higher than the preference numbers.
Schools are in no particular order.
Where there is a figure within brackets next to the places figure, this is the maximum number of pupils that the admission authority will admit. This number will have been agreed with the Local Authority.
Schools are in no particular order.
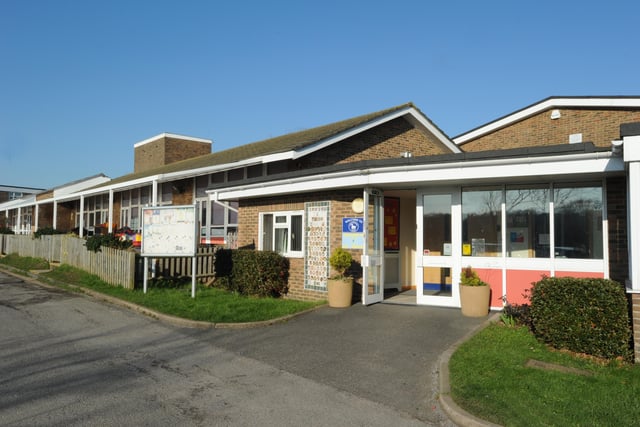
5.
Parkland Infant School (photo by Jon Rigby) 2021-2022 = 60 places, 45 1st pref, 45 1st pref given 2021-2020 = 60 places, 57 1st pref, 54 1st pref given 2020-2019 = 60 places, 59 1st pref, 58 1st pref given Photo: Hilsea Portsmouth
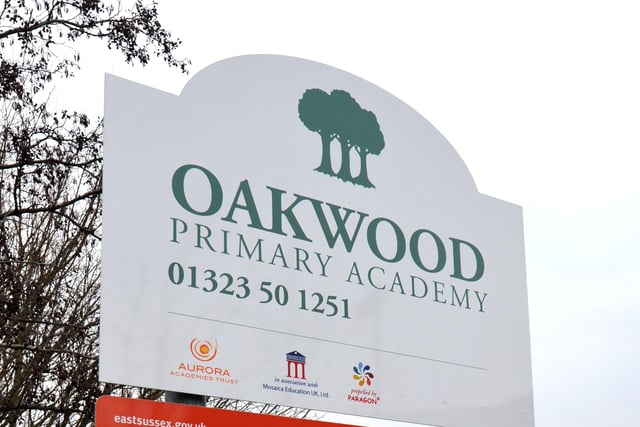
6.
Oakwood Primary Academy 2021-2022 = 60 places, 16 1st pref, 16 1st pref given 2021-2020 = 60 places, 27 1st pref, 27 1st pref given 2020-2019 = 60 places, 36 1st pref, 37 1st pref given
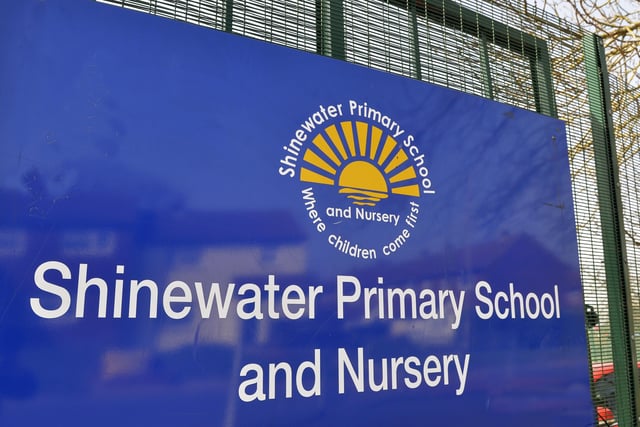
7.
Shinewater Primary School (photo by Jon Rigby) 2021-2022 = 60 places, 23 1st pref, 24 1st pref given 2021-2020 = 60 places, 26 1st pref, 28 1st pref given 2020-2019 = 60 places, 13 1st pref, 16 1st pref given Photo: Hilsea Portsmouth
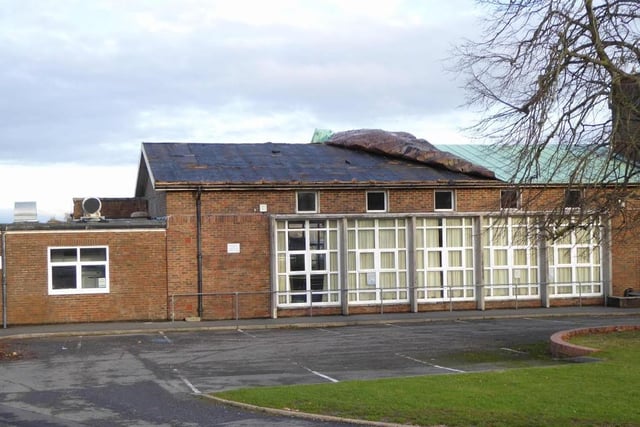
8.
Willingdon Primary School 2021-2022 = 60 places, 64 1st pref, 60 1st pref given 2021-2020 = 60 places, 58 1st pref, 57 1st pref given 2020-2019 = 60 places, 44 1st pref, 44 1st pref given